How Accurate Are Spreadsheets in the Cloud?

For a vector x with n elements the sample variance is s_n^2 = \frac{1}{n-1} \sum_{i=1}^n (x_i - \overline{x})^2, where the sample mean is \overline{x} = \frac{1}{n} \sum_{i=1}^n x_i. An alternative formula often given in textbooks is s_n^2 = \frac{1}{n-1} \left( \sum_{i=1}^n x_i^2 - \frac{1}{n} \left(\sum_{i=1}^n x_i \right)^2 \, \right). This second formula has the advantage that it can be computed with just one pass through the data, whereas the first formula requires two passes. However, the one-pass formula can suffer damaging subtractive cancellation, making it numerically unstable. When I wrote my book Accuracy and Stability of Numerical Algorithms I found that several pocket calculators appeared to use the one-pass formula.

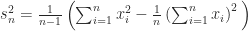
How do spreadsheets apps available in web browsers and hosted in the cloud fare on computations such as this? I used Google Sheets to compute the standard deviation of vectors of the form x = [m, m+1, m+2] (Google Sheets does not seem to have a built-in function for the sample variance; the standard deviation is the square root of the sample variance). Here is what I found. (The spreadsheet that produced these results is available as this xlsx file. Note that if you click on that link it will probably load into Excel and display the correct result.)

m Exact standard deviation Google’s result
10^7 1 1
10^8 1 0

The incorrect result 0 for m=10^8 is what I would expect from the one-pass formula in IEEE double precision arithmetic, which has the equivalent of about 16 significant decimal digits of precision, since \sum_{i=1}^n x_i^2 and \frac{1}{n} \left(\sum_{i=1}^n x_i\right)^2 are both about 10^{16} and so there is not enough precision to retain the difference (which is equal to 2). A computation in MATLAB verifies that the one-pass formula returns 0 in IEEE double precision arithmetic.

It seems that Google Sheets is using IEEE double precision arithmetic internally, because the expression 3\times (4/3-1)-1 evaluates to 2.2E-16. So it appears that Google may be using the one-pass formula.

This use of the unstable formula is deeply unsatisfactory, but it is just the tip of the iceberg. In a recent paper Spreadsheets in the Cloud—Not Ready Yet, Bruce McCullough and Talha Yalta show that Google Sheets, Excel Web App and Zoho Sheet all fail on various members of a set of “sanity tests”. This might not be too surprising if you are aware of McCullough’s earlier work in which he found errors in several versions of Microsoft Excel.

However, spreadsheets in the cloud bring further complications, as noted by McCullough and Yalta:

  • These spreadsheets apps do not carry version information and the software can be changed by the provider at any time without announcement. It is therefore impossible to reproduce results computed previously.
  • The hardware and software environment on which the software is running is not specified, which adds another level of irreproducibility.
  • McCullough and Yalta found that the Excel Web App could produce different output from Excel 2010. Anyone moving a spreadsheet between the two applications could be in for a surprise.

The conclusion: use spreadsheets in the cloud at your peril! In fact, I avoid spreadsheets altogether. Anything I want to do can be done better in MATLAB, LaTeX or Emacs ORG mode.

SIAM Conference on Computational Science and Engineering 2013

As predicted in my my preview post, this conference, held on the Boston waterfront, proved to be SIAM’s largest ever, with 1378 attendees. Over 1000 presentations were given in up to 20 parallel minisymposia at a time, but this did mean that there was at least one talk (and usually several) of interest to me in almost every time slot.

One thing I learned from the conference is how widely Python is being used in computational science, especially for solving real world problems involving large amounts of data. This is partly due to its ability to act as the glue between codes written in other languages and web applications. The IPython environment, with its notebook interface, was featured in a number of talks, in some of which the slides were displayed using the notebook.

The following highly selective photos will give a flavour of the conference.

file://d:/dropbox/org/images/130225-0726-35-1605.jpg The conference venue. Note the residual snow, which fortunately did not fall in any serious amounts during the conference.

file://d:/dropbox/org/images/130226-2124-20-1630.jpg The poster session of about 65 posters was preceded by a poster blitz (1 minute presentations) and was accompanied by an excellent dessert. This photo shows Edvin Deadman (University of Manchester and NAG Ltd.) discussing his poster on Matrix Functions and the NAG Library with Cleve Moler and Charlie Van Loan (authors of the classic Nineteen Dubious Ways to Compute the Exponential of a Matrix paper). For some thoughts on poster sessions by one of the conference attendees see Please, no posters! by David Gleich.

file://d:/dropbox/org/images/130227-1327-55-1690.jpg 
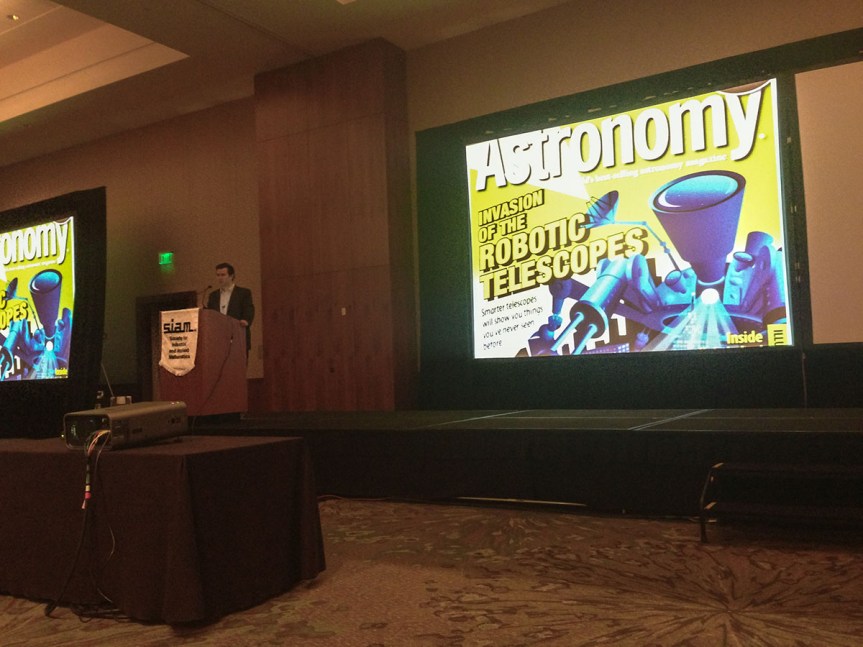
Josh Bloom’s (UC Berkeley) invited presentation Automated Astrophysics in the Big Data Era contained a fascinating mix of observational astronomy, machine learning, robotic telescopes, numerical linear algebra, and Python, with a focus on classifying stars.

file://d:/dropbox/org/images/130228-1629-26-1706.jpg 
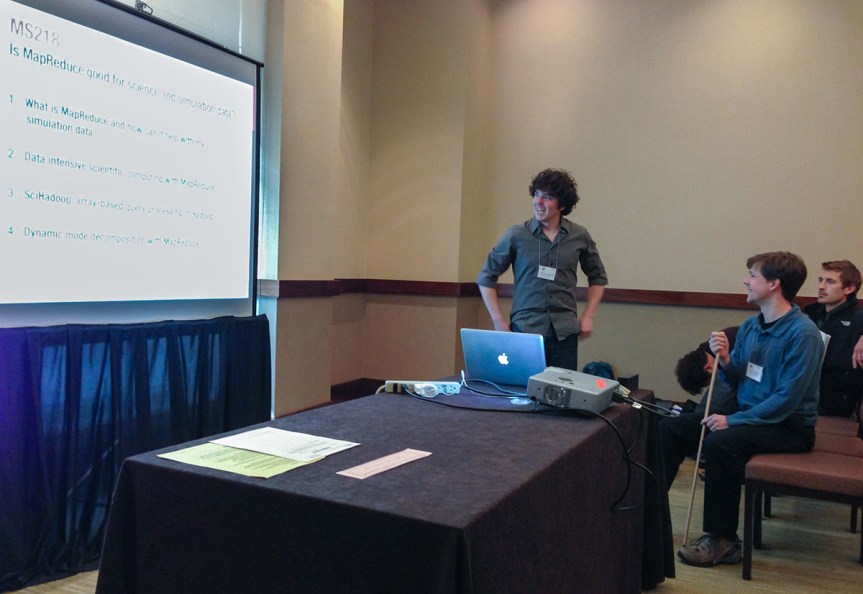
It was interesting to see MapReduce being used to implement numerical algorithms, notably in the minisymposium Is MapReduce Good for Science and Simulation Data? organized by Paul Constantine (Stanford; standing) and David Gleich (Purdue; sitting, with pointer).

file://d:/dropbox/org/images/130227-1157-03-1678.jpg 
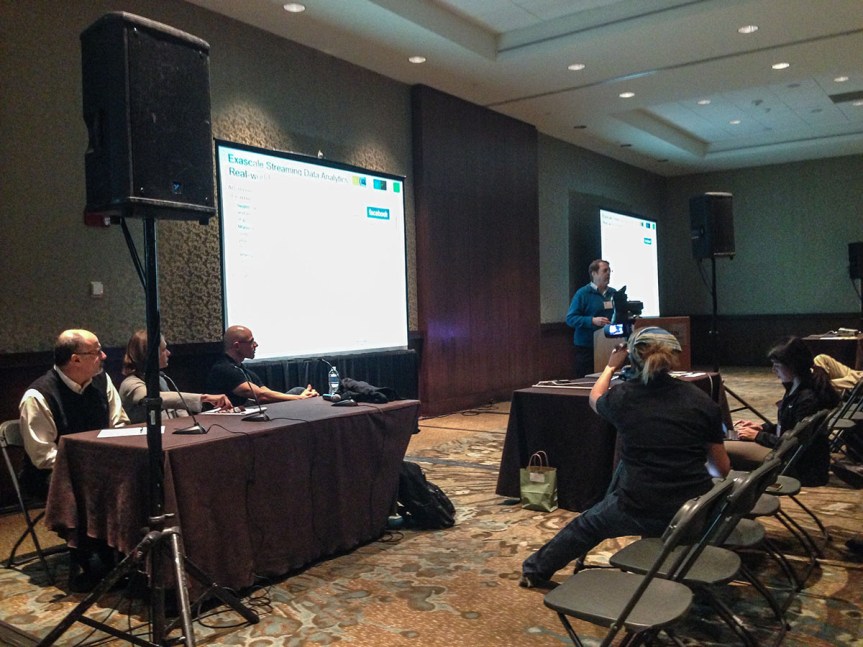
Here is the lunchtime panel Big Data Meets Big Models being videod. Highlights from this panel and some of the invited plenary talks will be available in due course on the SIAM Presents YouTube channel.

If you weren’t at the conference perhaps you can make it to the next one in two year’s time (date and location to be announced). In the meantime a good way to keep up with events is to join the SIAM Activity Group on Computational Science and Engineering, which organizes the conference.

Tiny Relative Errors

Let x\ne0 and y be distinct floating point numbers. How small can the relative difference between x and y be? For IEEE double precision arithmetic the answer is u = 2^{-53} \approx 1.1 \times 10^{-16}, which is called the unit roundoff.

What if we now let x and y be vectors and define the relative difference as d(x,y) = \|x-y\|_{\infty}/\|x\|_{\infty}, where the infinity norm is \|x\|_{\infty} = \max_i |x_i|? It does not seem to be well known that d(x,y) can be much less than u. I have observed this phenomenon numerous times over the years but had not previously stopped to wonder how it could happen. An example is
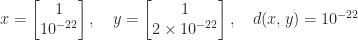
x = \begin{bmatrix}1 \\ 10^{-22} \end{bmatrix}, \quad  y = \begin{bmatrix}1 \\ 2\times 10^{-22} \end{bmatrix}, \quad d(x,y) = 10^{-22}.

Notice that the largest element(s) in magnitude of x agrees with the corresponding element(s) of y. This is, in fact, the only way that d(x,y) < u is possible.

Theorem (Dingle & Higham, 2013).
Let x\ne0 and y be n-vectors of normalized floating point numbers.
If d(x,y) < u then x_k = y_k for all k such that |x_k| = \|x\|_{\infty}.

This result, and the scalar case mentioned above, are proved in

Nicholas J. Higham and Nicholas J. Dingle, Reducing the Influence of Tiny Normwise Relative Errors on Performance Profiles, MIMS EPrint 2011.90; to appear in ACM Trans. Math. Soft.

Performance profiles, introduced by Dolan and Moré in 2002, are a popular way to compare competing algorithms according to particular measures of performance, such as relative error or execution time. We show in the paper above that tiny relative errors can result in misleading performance profiles and show how a simple transformation of the data can lead to much more useful profiles. For more, see the paper or the talk Numerical Issues in Testing Linear Algebra Algorithms that I gave at the SIAM Conference on Computational Science and Engineering in Boston last week.