Photo Highlights of 2017

Here are some of my favourite photos taken at events that I attended in 2017.

Atlanta (January)

This was the first time I have attended the Joint Mathematics Meetings, which were held in Atlanta, January 4-7, 2017. It was a huge conference with over 6000 attendees. A highlight for me was the launch of the third edition of MATLAB Guide on the SIAM booth, with the help of The MathWorks: 170106-1123-14-5528.jpg 
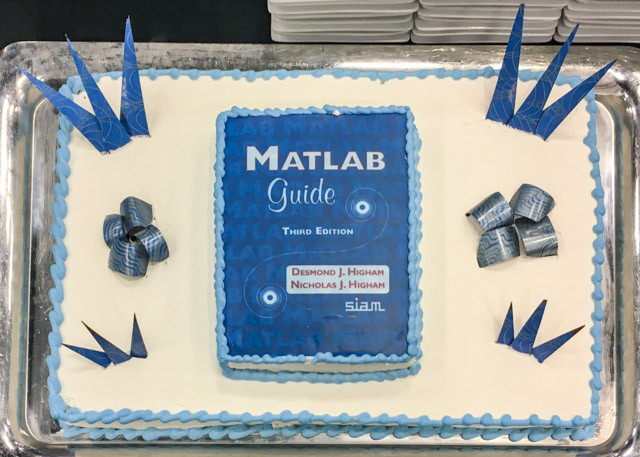
Elizabeth Greenspan and Bruce Bailey looked after the SIAM stand: 170105-2056-12_5438.jpg 
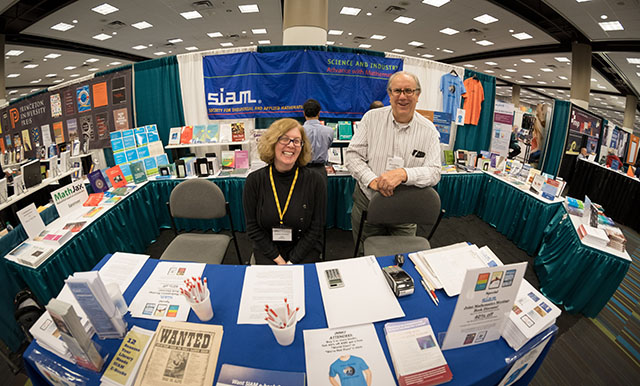
If you are interested in writing a book or SIAM, Elizabeth would love to hear from you!

The conference was held in the Marriott Marquis Hotel and the Hyatt Regency Hotel, both of which have impressive atriums. This photo is taken taken with a fish-eye lens, looking up into the Marriott Marquis Hotel’s atrium 170104-2015-50-5388.jpg 
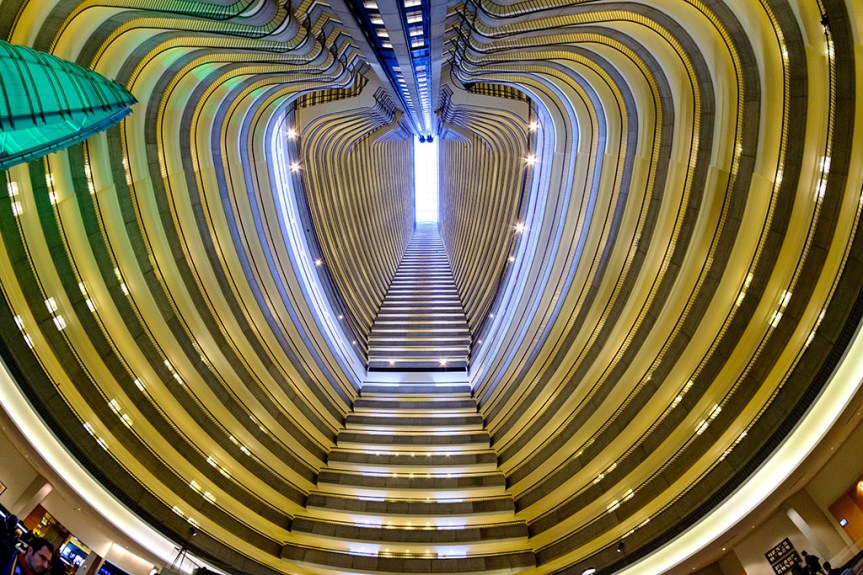
(For more photos, see Fuji Fisheye Photography: XT-2 and Samyang 8mm).

Atlanta (March)

I was back in Atlanta for the SIAM Conference on Computational Science and Engineering, February 27-March 3, 2017. A highlight was a 70th birthday dinner celebration for Iain Duff, pictured here speaking at the Parallel Numerical Linear Algebra for Extreme Scale Systems minisymposium: 170228-1020-54-5783.jpg 
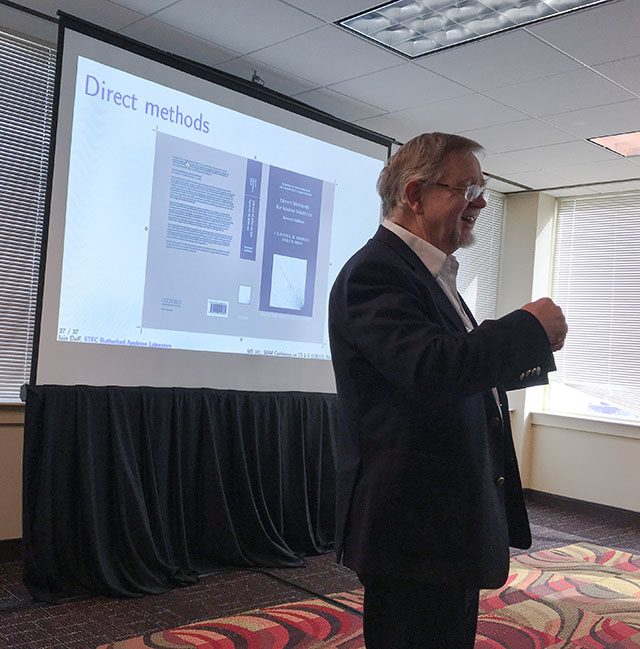
Here is Sarah Knepper of Intel speaking in the Batched Linear Algebra on Multi/Many-Core Architectures symposium (a report on which is given in the blog post by Sam Relton) 170227-1712-57_5700.jpg 
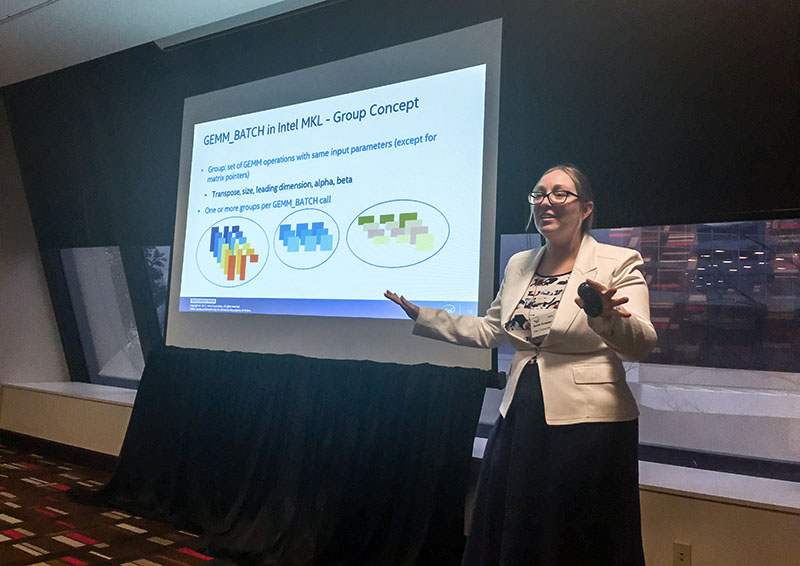
Torrential rain one night forced me to take shelter on the way back from dinner, allowing a moment to capture this image of Peach Tree Street.
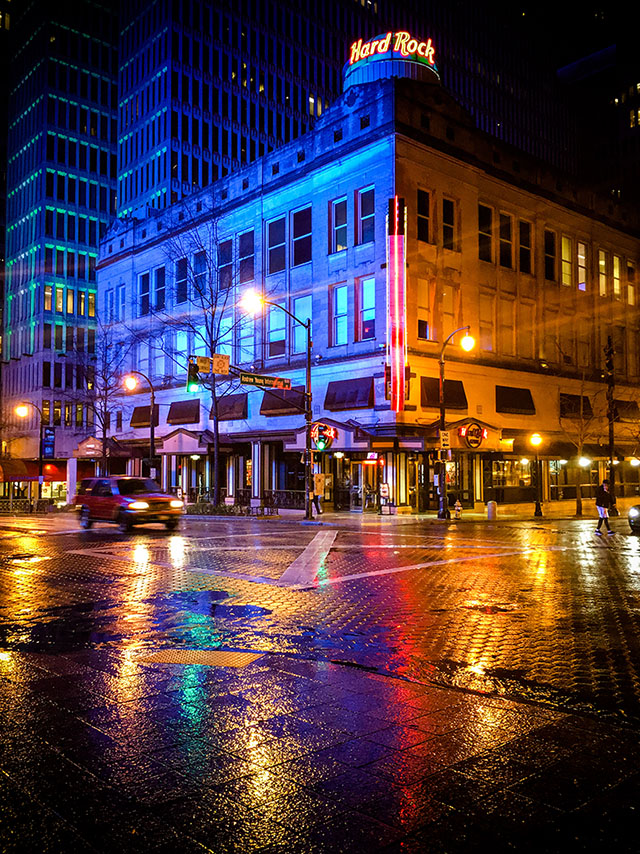
 170301-1945-22_6376.jpg

Washington (April)

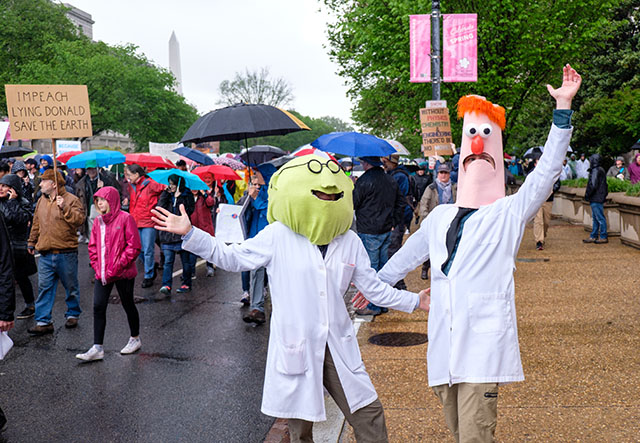
The National Math Festival was held at the Walter E. Washington Convention Center in Washington DC on April 22, 2017: 170422-1537-57_6202.jpg 
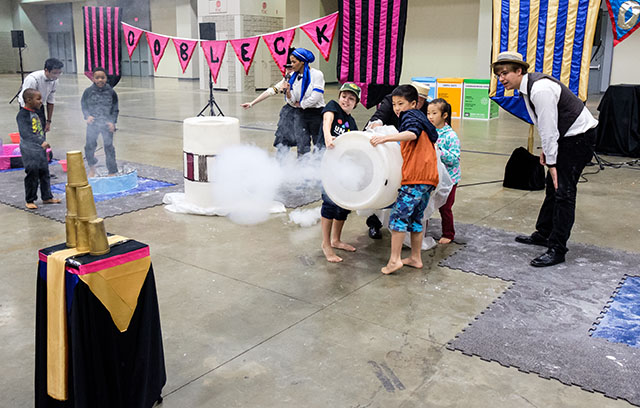
I caught the March for Science on the same day:
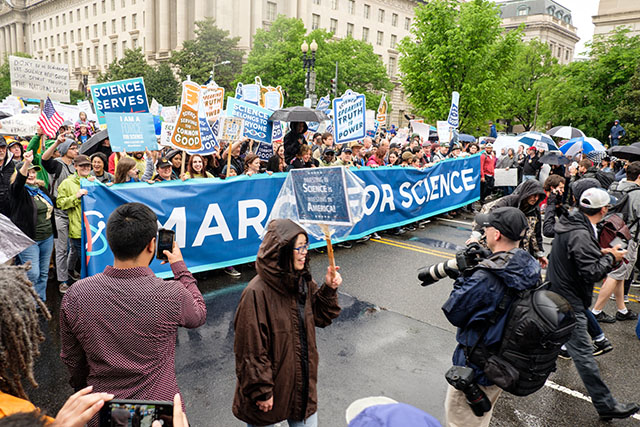
 170422-1917-01_6325.jpg 170422-1944-58_6455.jpg

Pittsburgh (July)

The SIAM Annual Meeting, held July 10-14, 2017 at the David Lawrence Convention Center in Pittsburgh, was very busy for me as SIAM president. Here is conference co-chair Des Higham speaking in the minisymposium “Advances in Mathematics of Large-Scale and Higher-Order Networks”: 170713-1033-16_7413.jpg Emily Shuckburgh gave the I.E. Block Community Lecture “From Flatland to Our Land: A Mathematician’s Journey through Our Changing Planet”: 170712-1821-50_7337.jpg 
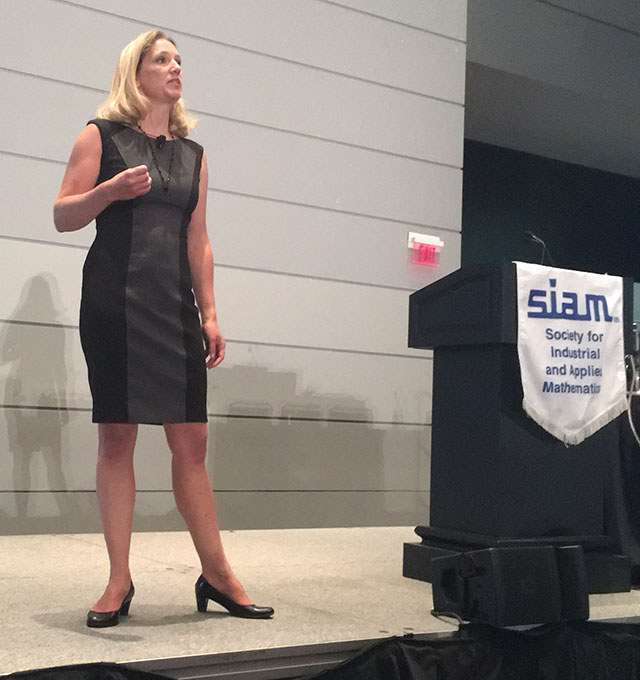
The Princeton Companion to Applied Mathematics was on display on the Princeton University Press stand: 170710-1728-15_7289.jpg 
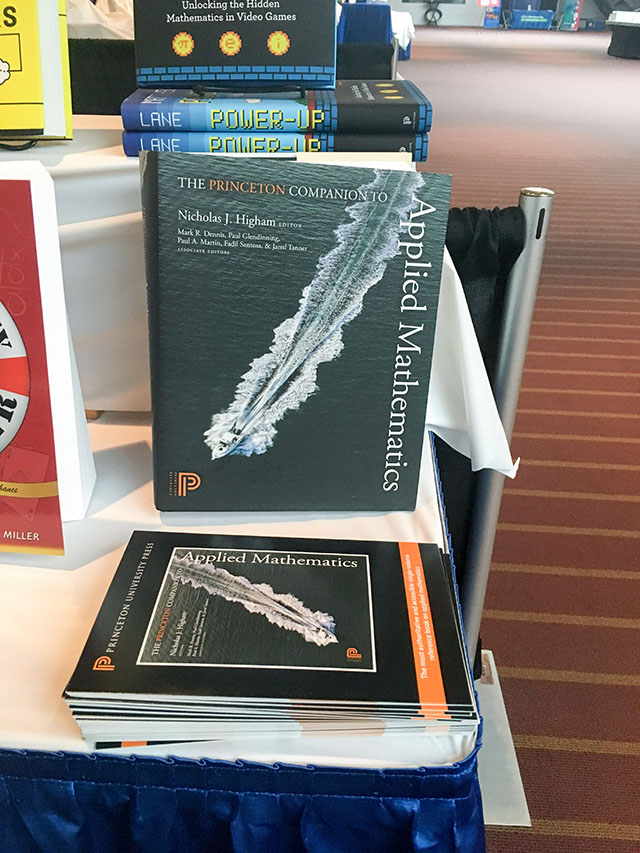
Here are Des and I on the Roberto Clemente bridge over the Allegheny River, the evening before the conference started:
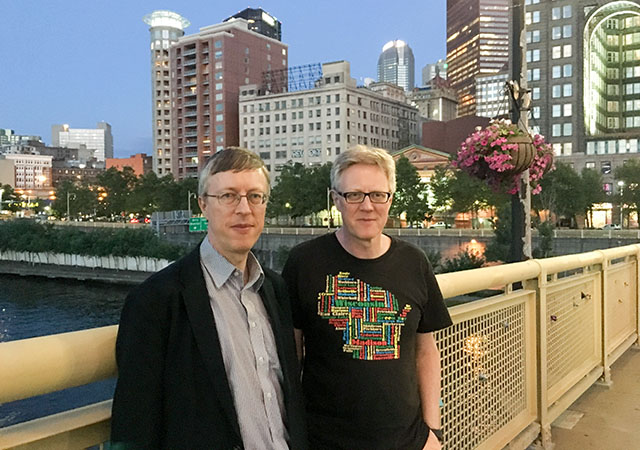
 170708-2121-33_7255.jpg

Mathematics and Digital Photography

A few months ago I wrote a post Mathematics in Color, in which I discussed some mathematical aspects of color and showed how a simple change of basis from RGB color space to LAB color space can enable dramatic color changes to be done very easily.

Over the last decade most recent developments in digital imaging software such as Adobe Lightroom and Adobe Photoshop have been based on advanced mathematics, yet many of the most powerful and useful transformations that one can make to an image are based on elementary mathematics and have been possible since the early versions of the products. For example, with every click of the healing brush—which might, for example, be used to remove a stray piece of litter in a landscape or a skin imperfection in a portrait—Photoshop solves a partial differential equation. Yet global operations such as changes to colour and contrast can be done with commands (and in particular, masks) that amount to simple addition and multiplication operations.

I’ve just launched a new blog on photography and digital imaging in which one theme will be exploiting elementary mathematics in digital imaging. The first post shows how the much-used Clarity tool in Lightroom and Photoshop can be applied in a more effective way by taking what amounts to a componentwise linear combination of the images before and after Clarity has been applied.

Head over to the post Refined Use of the Clarity Tool in Photoshop to find out more.

151022-1904-14-2639-cropped.jpg
Original (cropped) image.

151022-1904-14-2639-clarity100-cropped.jpg
With Clarity applied in blended fashion. Compare the water, clouds, and trees with the original.

Mathematics in Color

circle-rgb.jpg

Color is a fascinating subject. Important early contributions to our understanding of it came from physicists and mathematicians such as Newton, Young, Grassmann, Maxwell, and Helmholtz. Today, the science of color measurement and description is well established and we rely on it in our daily lives, from when we view images on a computer screen to when we order paint, wallpaper, or a car, of a specified color.

For practical purposes color space, as perceived by humans, is three-dimensional, because our retinas have three different types of cones, which have peak sensitivities at wavelengths corresponding roughly to red, green, and blue. It’s therefore possible to use linear algebra in three dimensions to analyze various aspects of color.

Metamerism

A good example of the use of linear algebra is to understand metamerism, which is the phenomenon whereby two objects can appear to have the same color but are actually giving off light having different spectral decompositions. This is something we are usually unaware of, but it is welcome in that color output systems (such as televisions and computer monitors) rely on it.

Mathematically, the response of the cones on the retina to light can be modeled as a matrix-vector product Af, where A is a 3-by-n matrix and f is an n-vector that contains samples of the spectral distribution of the light hitting the retina. The parameter n is a discretization parameter that is typically about 80 in practice. Metamerism corresponds to the fact that Af_1 = Af_2 is possible for different vectors f_1 and f_2. This equation is equivalent to saying that Ag = 0 for a nonzero vector g = f_1-f_2, or, in other words, that a matrix with fewer rows than columns has a nontrivial null space.

Metamerism is not always welcome. If you have ever printed your photographs on an inkjet printer you may have observed that a print that looked fine when viewed indoors under tungsten lighting can have a color cast when viewed in daylight.

LAB Space: Separating Color from Luminosity

In digital imaging the term channel refers to the grayscale image representing the values of the pixels in one of the coordinates, most often R, G, or B (for red, green, and blue) in an RGB image. It is sometimes said that an image has ten channels. The number ten is arrived at by combining coordinates from the representation of an image in three different color spaces. RGB supplies three channels, a space called LAB (pronounced “ell-A-B”) provides another three channels, and the last four channels are from CMYK (cyan, magenta, yellow, black), the color space in which all printing is done.

LAB is a rather esoteric color space that separates luminosity (or lightness, the L coordinate) from color (the A and B coordinates). In recent years photographers have realized that LAB can be very useful for image manipulations, allowing certain things to be done much more easily than in RGB. This usage is an example of a technique used all the time by mathematicians: if we can’t solve a problem in a given form then we transform it into another representation of the problem that we can solve.

As an example of the power of LAB space, consider this image of aeroplanes at Schiphol airport.

060721-1320-30-8896-org.jpg
Original image.

Suppose that KLM are considering changing their livery from blue to pink. How can the image be edited to illustrate how the new livery would look? “Painting in” the new color over the old using the brush tool in image editing software would be a painstaking task (note the many windows to paint around and the darker blue in the shadow area under the tail). The next image was produced in just a few seconds.

060721-1320-30-8896-lab.jpg
Image converted to LAB space and A channel flipped.

How was it done? The image was converted from RGB to LAB space (which is a nonlinear transformation) and then the coordinates of the A channel were replaced by their negatives. Why did this work? The A channel represents color on a green–magenta axis (and the B channel on a blue–yellow axis). Apart from the blue fuselage, most pixels have a small A component, so reversing the sign of this component doesn’t make much difference to them. But for the blue, which has a negative A component, this flipping of the A channel adds just enough magenta to make the planes pink.

You may recall from earlier this year the infamous photo of a dress that generated a huge amount of interest on the web because some viewers perceived the dress as being blue and black while others saw it as white and gold. A recent paper What Can We Learn from a Dress with Ambiguous Colors? analyzes both the photo and the original dress using LAB coordinates. One reason for using LAB in this context is its device independence, which contrasts with RGB, for which the coordinates have no universally agreed meaning.

The Princeton Companion to Applied Mathematics

My article Color Spaces and Digital Imaging in The Princeton Companion to Applied Mathematics gives an introduction to the mathematics of color and the representation and manipulation of digital images. In particular, it emphasizes the role of linear algebra in modeling color and gives more detail on LAB space.

I have one update to the article. Since the book went to press a second edition of the book that I cite by Dan Margulis, Photoshop LAB Color: The Canyon Conundrum And Other Adventures In The Most Powerful Colorspace, has appeared (amazon.com and amazon.co.uk). I do not yet have the book but it appears to have a number of improvements on the excellent first edition.

Finally, in the article I mention the problem of finding good color maps and the problems with the commonly used rainbow color map. For a nicely illustrated talk on this topic see Perceptual Color Maps in matplotlib for Oceanography given at SciPy 2015 by Kristen Thyng.

University-of-Manchester-Maths-059.jpg
The author speaking about rainbow color maps at a UoM School of Mathematics Alumni Event at The Royal Institution, London. Photo: Chris Mann Photography.